Update November 3 see below
October 26th 2020
The entire Corona debate stands or falls with the use of the PCR test
All the alarming numbers we hear every day are based on this test.
All measures currently being issued are based on results and interpretations of this test, which is used as the main parameter to monitor the corona crisis. The isolation measures/ work ban, the contact tracing for healthy people, the mask obligation for healthy people, the mandatory test after returning from a “red zone”, closing the catering industry …
We have serious doubts about this.
- This test was rushed through with an urgent procedure and was never seriously self-tested for its ability to measure what it should measure. There is no gold standard to compare test results with. 1
- The creator Kary Mullis explicitly warned that the polymerase chain reaction (PCR) test was for research and not diagnostics. 1 2
- The PCR test is an extremely non-specific test that can yield a lot of false positives (up to 90%). 3
- The PCR test works with cycles of amplification of genetic material – a piece of virus genome is enlarged each time. Any contamination (e.g. other viruses, debris of old virus genome) can possibly test a false positive. 2 Remaining virus fragments after an infection have been found to be detectable in the body for weeks. 2 3 In a healthy person who tests positive, these old virus fragments from a previous infection may be measured. 4
- The number of amplification cycles is called the CT (cycle threshold) value. In principle, it is recommended to keep it below 24. 11 Values between 24 – 35 are seen as a gray area. Above, the chance of false positives increases sharply. In many labs, however, the genetic material is amplified up to 37 to 40 (or more) times. 6 7 Of 11 Belgian labs, we do not even know which CT values are used. 5
- If the test is positive in someone, it does not mean that person is actually clinically infected, is ill or will become ill.
We cannot therefore equate positive tests in healthy people with infections.
Yet we hear this equation in the media all the time. Never before has an epidemic been evaluated on the testing of healthy individuals. Testing healthy people is unscientific and an immense waste of money. It doesn’t teach us anything.
We cannot automatically equate positive tests with infection with the corona virus in the case of sick people.
- Interference with many other viruses (false-positives) is possible when using the test. In a sick person who tests positive, it may therefore be an infection with a virus other than the corona virus. 2
- Sick people are currently usually only tested for corona and not for other viruses. Research shows that both sick and healthy people often carry a mix of viruses. Testing patients with ILI (influenza like illness) is therefore ideally done with a “respiratory viral panel test” (often used in paediatrics), which detects a whole number of viruses at the same time.
Conclusion: We cannot draw any diagnostic conclusions from a positive PCR test. That is exactly what the inventor warned us about: the test itself is not suitable for diagnostics.
The completely incorrect use of the PCR test leads to the conclusion that there would be a second wave.
If we did NOT use this test, how would we decide on a second wave?
Let’s just use our common sense: look at sick, hospitalizations and deaths.
The so-called second wave and all measures are based on 3 pillars
- Increased positive tests: the PCR test is NOT diagnostic and does not say anything about infectiousness and/or active infection. 1 2 8 11 Sciensano and RIVM admit this. 5
- The mortality rates
-
- The mortality rates we observe should increase sharply compared to the mortality rates of the previous years in the same period. We call this the “excess mortality”.
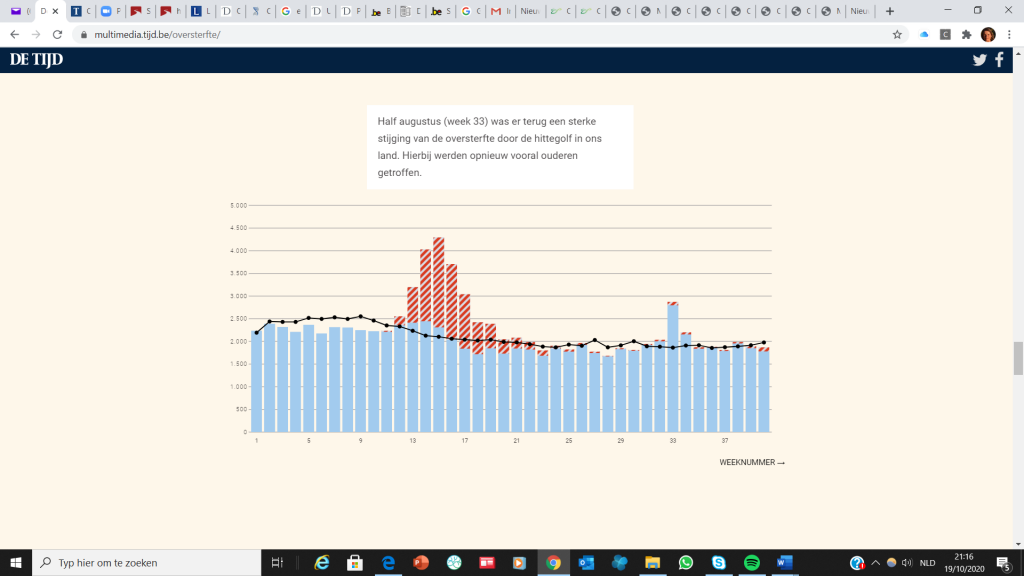
Excess mortality in Belgium
Excess mortality in Europe
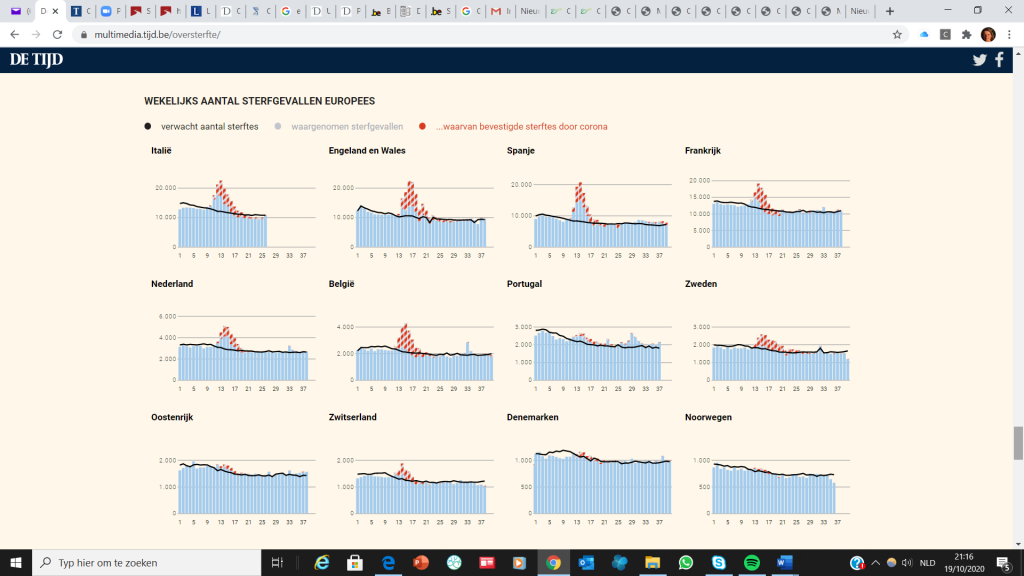
There was indeed an excess mortality in the months of March and April and a small peak during the heat wave in August. But not afterwards (data up to week 40).
-
- Infection fatality rate
A new WHO report, filed May 13 and published October 14, shows that the average infection fatality rate of covid-19 is 0.23%, as opposed to the 3.4% reported in
March.9
- Hospitalizations should increase sharply. Here too, we have to make a comparison with previous years – is what we see normal and expected?
Every autumn we see a cyclical wave of flu infection in which more people – especially the elderly – are hospitalized. In such a wave we see a mix of flu viruses that follow in a curve: first the rhinoviruses, then the influenza A and B viruses, followed by the coronaviruses. At the moment people are tested almost exclusively for corona.
Are there currently more hospitalizations than in previous years?
In recent years, the Sentinel Surveillance Network has provided valuable information on influenza, influenza like illness (ILI) and severe acute respiratory illness (SARI). Sentinel Surveillance currently appears to be the only reliable data source, which has been approved by many countries and Belgium and is consistently used for their own source material.
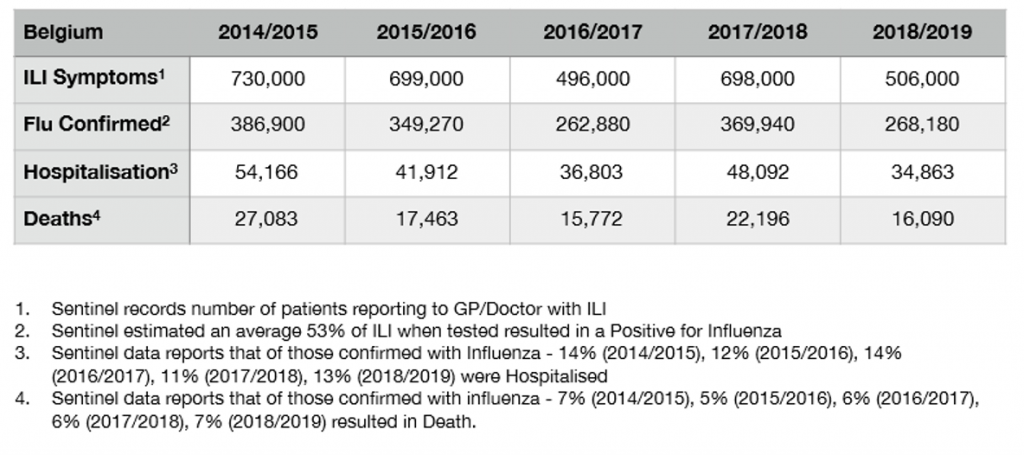
For comparison: on October 24, 2020, the figures of the coronavirus in Belgium are:
287700 cases 25448 hospitalizations 10658 deaths
At present, which is very uncommon, no data is available on the number of influenza cases, although WHO reports suggest an unusually low number of influenza cases (details are also not available here).
Moreover, Sciensano did make some serious calculation errors in recent weeks. In 4 weeks time, 1280 beds came out of nowhere (see calculation below). Sciensano refuses to disclose the data per hospital. 10
The disproportionate measures now being taken are not supported by the objective facts and cause immense collateral damage.
-
-
- https://bpa-pathology.com/covid19-pcr-tests-are-scientifically-meaningless/
- https://www.cebm.net/covid-19/pcr-positives-what-do-they-mean/
- https://worlddoctorsallianccom/
- https://www.be/binnenland/was-er-deze-zomer-wel-een-tweede-coronagolf-analyse-van-positieve-testen-legt-verbijsterend-patroon-bloot~adbe2b81d/
- https://covid-19.sciensano.be/sites/default/files/Covid19/30300630_Advice_RAG_interpretation%20PCR.pdf?fbclid=IwAR2SBHiu1Q3c-GlUnWQFIjGsPLk0uzOqxMfWoh5nokFI9hfx3oq6dbCQoTE
- https://www.nytimes.com/2020/08/29/health/coronavirus-testing.html?fbclid=IwAR2Oj8AXiA6QKxdf6T3PuW8UxWfrzJYak2sUAnDOb9ccec8h2duIp0TngzU
- by Prof. Carl Heneghan, professor of evidence-based medicine at the University of Oxford and director of the Centre for Evidence-Based Medicine. https://www.spectator.co.uk/article/could-mass-testing-for-covid-19-do-more-harm-than-good-
- https://www.gentechvrij.nl/2020/08/15/foute-interpretatie/
- https://www.who.int/bulletin/online_first/BLT.20.265892.pdf?fbclid=IwAR2TzcKiS0PEDNGPPP8RjmgsI88MSNtN7paPKgKNItxsuTzZ-Q5Yiw7boGc
- https://www.vrt.be/vrtnws/nl/2020/10/16/_sciensano-moet-meer-coronagegevens-vrijgeven/
- https://www.hpdetijd.nl/2020-09-27/drie-wetenschappers-de-coronatest-is-onbetrouwbaar-en-het-testbeleid-faalt/
-
Recalculation of figures by Sciensano
Just a short recalculation of the figures provided by Sciensano…. Feel free to bring your pocket calculator to calculate this.
Sunday September 27: 654 hospital beds
Sunday 4 October: 866 hospital beds, so + 212 beds
However, between September 28 and October 4, 541 lab-confirmed Covid-19 cases were admitted and 404 left the hospital, so +137
https://covid-19.sciensano.be/sites/default/files/Covid19/COVID-19_Daily%20report_20201005%20-%20NL.pdf
212 – 137 = 75!
75 new beds just appear out of nowhere
Let’s do this again:
Sunday, October 4: 866 hospital beds taken
Sunday 11 October: 1329 hospital beds were taken, so + 463 beds.
But: Between October 5 and October 11, 879 new lab-confirmed Covid-19 cases were admitted and 586 left the hospital, so + 293
https://covid-19.sciensano.be/sites/default/files/Covid19/COVID-19_Daily%20report_20201012%20-%20NL.pdf
463 – 293 = 170!
170 extra beds just appear out of nowhere
Sunday 11 October: 1331 hospital beds taken (+2 – correction?)
Sunday October 18: 2485 hospital beds taken, so + 1154 beds
But, between October 12 and October 18: 1763 new lab-confirmed Covid 19 cases were admitted and 885 left the hospital, so + 878
https://covid-19.sciensano.be/sites/default/files/Covid19/COVID-19_Daily%20report_20201019%20-%20NL.pdf
1154 – 878 = 276!
276 extra beds just appear out of nowhere
Sunday 18 October: 2497 hospital beds taken (+12 – correction?)
Sunday October 25: 4827 hospital beds taken, so + 2330 beds
But, between October 19 and October 25: 3275 new lab-confirmed Covid 19 cases were admitted and 1704 left the hospital, so + 1571
https://covid-19.sciensano.be/sites/default/files/Covid19/COVID-19_Daily%20report_20201026%20-%20NL.pdf (October 26)
2330 – 1571 = 759!
759 extra beds just appear out of nowhere
So, in 4 weeks time, 1280 beds just appear out of nowhere!
Update 2nd wave (November 3, 2020)
Excess mortality
Until week 43 NO excess mortality in September and October 2020 – see page 13
https://epidemio.wiv-isp.be/ID/diseases/SiteAssets/Pages/Influenza/Influenza_2020_43.pdf
The virus replication rate (Rt) has stagnated around October 10 and been declining since October 23
https://epistat.wiv-isp.be/covid/covid-19.html
Recalculation of Sciensano figures – addition
Sunday, October 25: 4825 hospital beds taken (-2)
Sunday November 1: 6823 hospital beds taken, so + 1998 beds
But: Between October 26 and November 1, 4591 new lab-confirmed 19 covid cases were admitted and 2953 left the hospital, so + 1638
https://covid-19.sciensano.be/sites/default/files/Covid19/COVID-19_Daily%20report_20201102%20-%20NL.pdf
1998-1638 = 360
360 extra beds just appear out of nowhere
So in 5 weeks time 1640 beds appear out of nowhere